

As humans, we have not spent a lot of our history communicating by way of the written message as we do now.
For tens of thousands of years, we had an oral tradition but kept the most sacred of our information in pictures.
Cave drawings and symbols encoded the essence and the meaning of our most important ‘science’ and allowed us to convey important and complex concepts, where language wasn’t enough.
“The greatest value of a picture is when it forces us to notice what we never expected to see.”
– John W. Tukey
Our brains are hardwired to interpret pictures.
The printing press was invented in the 1430s however, it wasn’t until the 1920s that ‘peak literacy’ was achieved in the USA with 70% of people able to read and write.
It can be no surprise then that for most people, there is a preference still for verbal interpersonal communication and the use of pictures to convey complex information or to persuade others to a particular interpretation.
Charting Panic.
According to Yale University’s data professor, Edmund Tufte, “In good information visualisation, there are no rules, no guidelines, no templates, no standard technologies, no guidelines, no style books…you simply must do whatever it takes…”
Certainly, in 2020, we have seen the use of data visualisation to convey messages of caution in the face of the global outbreak of the Coronavirus, using line charts to represent the escalation of total cases. Line charts are commonly referred to as ‘panic charts’ in data representation…because they show a VERY steep curve of escalation as numbers rise higher.
For example, here is a line graph taken on 11 March 2020 of the total global cases since the first identification of the virus.
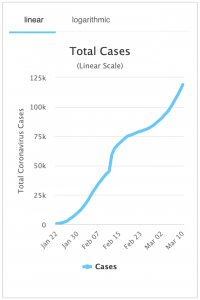
A linear representation of the global Coronavirus outbreak.
Source: https://www.worldometers.info/coronavirus/
Change your presentation of the data and change your perspective.
Naturally, when there are multiplying factors, such as the human transmission of disease – a line graph will show a steep increase once higher numbers are reached.
However, when the SAME data is represented logarithmically, taking into account these multiplicating factors and removing the skew of the low and high numbers, the same level of panic is not conveyed in the picture, see below.
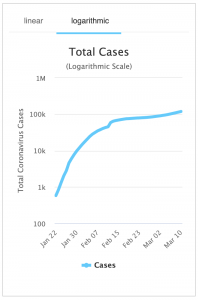
A logarithmic representation of the global Coronavirus outbreak.
Source: https://www.worldometers.info/coronavirus/
These graphs contain the SAME information, but one is more likely to educate people on why they need to wash their hands.
This is not the first time that data visualisation has been used to help with outbreaks.
One of the most famous data visualisations of all time was the 1854 Broad Street Cholera Outbreak Map, created by John Snow (not to be confused with Jon Snow from Game of Thrones – he knew nothing – ed.).
By plotting the number and concentration of deaths from cholera in a London neighbourhood, Snow was able to isolate the outbreak to a particular water pump and the outbreak was contained. It was a massive breakthrough in both medical and data science.
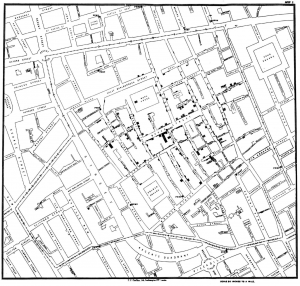
Visualisation by John Snow
Lessons for Real Estate.
Knowledge is power, and without the ability to make meaning from your most important business asset – your data, it is unlikely that you will be able to harness that power.
Visibility is key.
Quite often when we talk to vintage real estate agents, they talk about the difficulty they had in losing visibility over their data when they transitioned from Rolodex cards to a digitised CRM. There was more than just the written record on the card, but the tactile nature of the card – how worn it was around the edges, yellowing of the paper – all of these things were visual cues to the agent about the quality and age of the relationship.
Using advanced analytics techniques, RiTA is able to provide a full diagnosis on some of those important “quality” indicators of your data, and even more specifically the relationships between the humans in your business and the humans in your database.